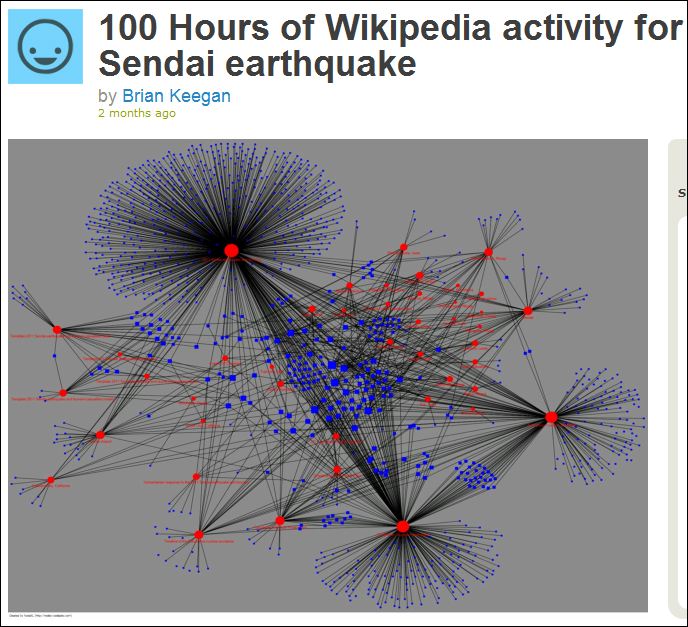
Follow this link to a description/explanation of a video "flip book" that shows the development of connections between Wikipedia authors and pages related to the Sendai earthquake.
http://vimeo.com/21088958
This is a good example of a creative use of NodeXL for data visualization. Marc Smith's blog and Flickr stream are great sources for other images, especially those using data from Twitter.
Blog: http://www.connectedaction.net/marc-smith/
Flickr: http://www.flickr.com/photos/marc_smith/with/5685714162/
Here is a recent twitter mention graph created by Marc:
http://www.connectedaction.net/2011/04/28/rw2011-a-royal-wedding-nodexl-twitter-map/
No comments:
Post a Comment