The first measured property, frequently referred to as the property being of scale free, is the distribution of degrees in the network. Degree distribution in social networks tends to follow a long tailed distribution with most individuals having a relatively small number of edges to other nodes and a select few having a large number of edges. The quality of being scale free can either be evaluated as a direct comparison of the distribution to the expected distribution or as a Power Law exponent indicating the overall distribution. Measuring the distribution of degrees also lends itself to the inclusion average number of degrees as a part of the desired creation of a scale free network.
I also added measurements for clustering and grouping. I measured the clustering coefficient, and the number of bicomponent clusters. The clustering coefficient measures the degree to which nodes are tightly connected, where as the number of bicomponent clusters provides a rough estimation of the number of distinct groups present in the graph structure. Also examined, though not formalized in a metric examined for each generated graph, was the distribution of clustering coefficients which, similar to the distribution of degrees, should be non-normally distributed and tend towards a long tailed distribution.
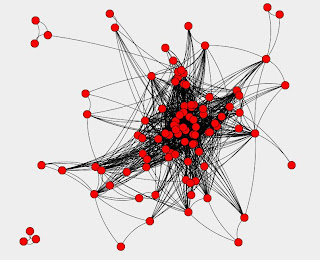
So what do all these new inputs and outputs mean? We can adjust the inputs of the simulation and see if we get better outputs! In an unprecedented feat of interactivity I supplied the class with a set of simulation inputs and suggested that the output of the clustering coefficient was higher than expected. An arbitrary audience member (Read: Ted) made a suggestion and when we adjusted the inputs we got a graph that more closely resembled what we might expect from an arbitrary social network. Below is our co-constructed graph as well as the distribution of edges:


No comments:
Post a Comment